5 Min Read
In the ever-evolving world of asset management, organizations face constant challenges to optimize operational efficiency, enhance productivity, and ensure the longevity of their assets. To achieve these goals, key performance indicators (KPIs) play a vital role in providing valuable insights into performance visibility & transparency, identifying asset performance gaps, and discovering improvement opportunities.

Maximo KPIs, within the context of asset management, refer to the key performance indicators that are tracked and measured using IBM Maximo, a comprehensive asset management platform. Businesses use Maximo KPIs for several reasons, including performance evaluation, strategic decision-making, predictive maintenance, and benchmarking performance metrics.
Understanding Maximo KPIs (Key Performance Indicators)
KPI Manager Application
The KPI Manager application is a central component of IBM Maximo that allows users to define, configure, and manage KPIs. It provides a user-friendly interface to create and maintain KPIs, define calculation formulas, and view historical trends. The historical trends tab allows users to compare KPIs, access historical data, and view data points for specific periods.

If you have KPI security access to the application manager, you can navigate to the Maximo application menu by logging into your account. In the application menu, click on the “Go To” menu option. Next, click on the “KPI Manager” option from the drop-down menu.
KPI Viewer Application
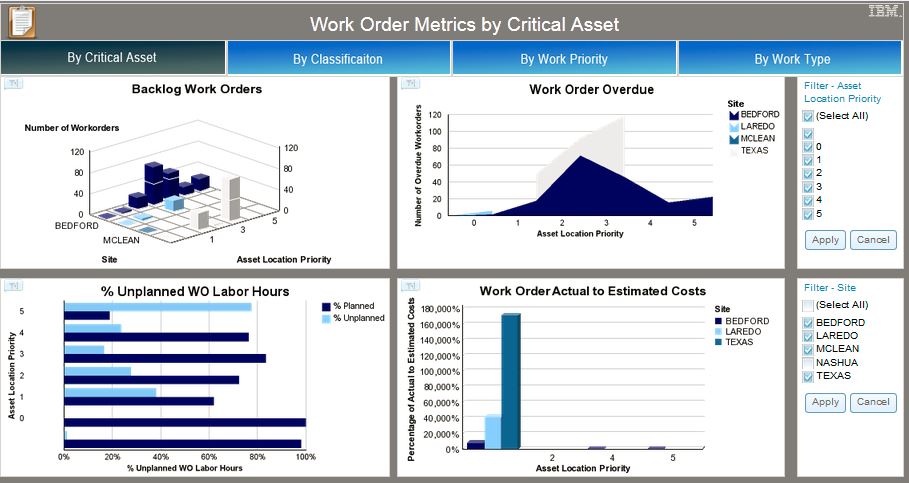
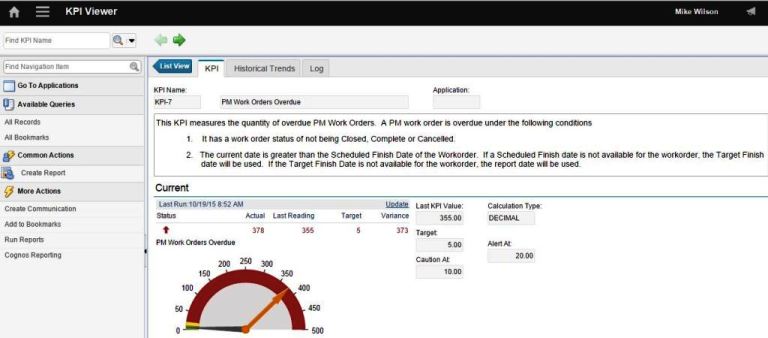
The KPI Viewer application is designed to visualize and analyze KPI data within Maximo. It provides users with a dashboard-like interface where they can view KPIs, track performance trends, and gain insights into asset performance. It is a comprehensive tool for monitoring KPIs and making informed decisions based on the data.
KPI Parameters
Maximo KPI Parameters are key performance indicators (KPIs) that are used in the IBM Maximo asset management system to measure and track the performance of assets, processes, or business operations. They provide meaningful metrics to assess the efficiency, effectiveness, and overall health of various aspects of an organization.
In order to set KPI parameters, businesses must identify objectives, define realistic KPIs, Establish targets, collect & analyze data, and regularly compare actual performance against the established targets.
KPI Graphs
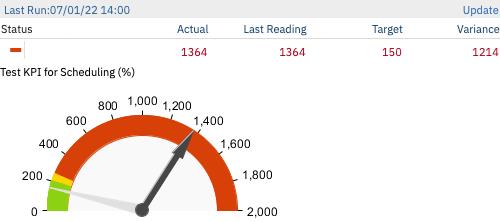
A KPI graph portlet provides a visual representation of KPIs over time, allowing you to track progress and monitor performance trends. They offer a concise and intuitive way to understand complex data and identify areas that require attention or improvement. KPI graphs ensure seamless performance tracking, target visualization, comparative analysis, and historical analysis to identify trends, patterns, and seasonality of business operations.

5 Must-have Maximo KPIs
- Schedule Compliance
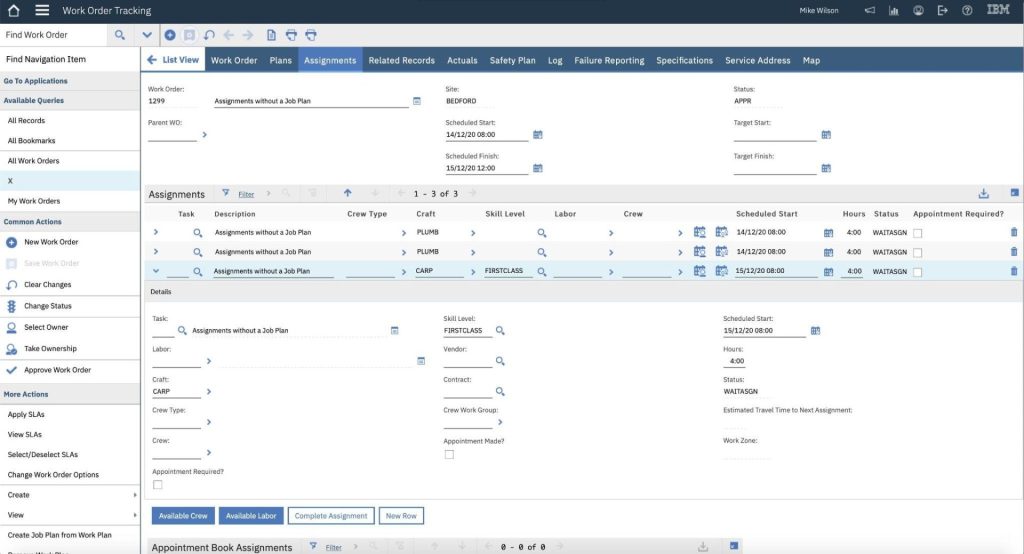
Schedule Compliance measures the extent to which work orders are completed within the scheduled time. It is important because schedule compliance percentage indicates the efficiency of the maintenance process and adherence to planned schedules. By tracking schedule compliance, organizations can identify bottlenecks, assess the impact of delays, and take corrective actions to improve overall asset management.
- PM Compliance
PM Compliance measures the percentage of preventive maintenance (PM) tasks completed as scheduled. Monitoring PM Compliance allows organizations to ensure that routine maintenance tasks are being performed on time, reducing the risk of equipment failures and extending asset lifespan & ability. By improving PM performance, organizations can enhance asset performance, minimize costly repairs, and increase overall operational efficiency

- Break-in/Break-out hours
Break-in/Break-out hours are the time spent on unscheduled maintenance activities, such as emergency repairs or unplanned breakdowns. Tracking these hours is important as they provide insights into the extent of unplanned work and the associated costs. By monitoring Break-in & Break-out hours, organizations can identify recurring issues, assess their impact on asset availability, and take proactive measures to address root causes.
- Gross Vs. Net Available Hours
Gross vs. net available hours compares the total available hours of an asset to the actual productive hours after accounting for scheduled downtime, maintenance activities, and other non-productive hours. This KPI is crucial for assessing asset availability and measuring overall equipment effectiveness. It helps in improving resource planning, minimizing idle time, and increasing asset productivity.

- Backlog WOs & Backlog Hours
Backlog WO (Work order) and Backlog Hours represent the number of pending work orders and the total hours required to complete them. These KPIs indicate the backlog of maintenance tasks and the associated workload. By tracking these KPIs, organizations can allocate resources effectively and ensure the timely completion of maintenance tasks.
How to Create and Maintain Maximo KPIs Using KPI Templates?
The following procedure is to be followed while creating and maintaining Maximo KPIs using the KPI templates application:
- In the KPI manager module or the KPI template application, go to Administration > Reporting > KPI Manager.
- Here, click on the create new KPI option. The KPI generated will be decimal type by default. Therefore, select the ‘Decimal’ option from the ‘Calculation Type’ dropdown options.
- Give a name to the KPI. Let’s assume the name given is PM Performance.
- Enter a Select statement, such as:
Select count (wonum) from workorder - Next, enter the ‘where’ clause in the KPI query, such as:
where status not in (‘COMP’, ‘CLOSE’) and istask = 0 and targstartdate < sysdate
However, if you wish to create a Percentage KPI, you must change the ‘Calculate Type’ to ‘Percentage.’ The SQL statement will now somehow look like this:
- select distinct (select count(wonum) from workorder where status in (‘COMP’,’CLOSE’) and worktype = ‘PM’ and istask = 0) /
(select count(wonum) from workorder where worktype = ‘PM’ and istask=0) * 100 from dummy_table
Best Practices
Here are some of the best practices to consider when setting up and maintaining KPIs over time:
- Clearly Define KPIs
- Keep KPIs Relevant
- Set Specific, Measurable, Achievable, Relevant, and Time-Bound Goals
- Use Balances Scorecards
- Regularly Monitor KPIs
- Leverage Technology and Automation
Common Challenges While Creating KPIs and How to Overcome Them
Some of the most common challenges while creating KPIs are unclear definitions of KPIs, inappropriate KPI selection, lack of data availability, availability of poor quality data, setting unrealistic targets, difficulty in calculating KPIs, insufficient training & support, and inadequate KPI maintenance.
It is important to be aware of these challenges and implement corrective approaches in order to overcome these challenges. For example, by leveraging built-in functions or scripting capabilities provided by the KPI tools can simplify complex calculations. Or historical data, benchmarks, industry standards, and organizational capabilities can be considered while defining KPI target values.
How to Add KPI to Your Start Center?
The goal of Start Centers is to provide quick access to KPI information and utilize the power of KPIs. Once you have created KPIs on the KPI manager application, you can add the KPIs to the Start Center by just adding a result set portlet. You can also choose the ‘KPI Graph’ option.
After adding the portlet, you have the liberty to edit and pick which KPI you want to view. Later, you can also ‘n’ number of KPIs to be displayed in one KPI graph.
Thanks to quick access to Maximo KPIs in the Start Center, users can get real-time performance visibility into critical performance metrics, detect KPI issues early, make informed decisions, and enhance productivity by automating the report generation process.
How to View and Collaborate on KPIs Outside of the Start Center
Maximo’s KPI Viewer Application allows users to seamlessly access KPIs outside the Start Center. The application can be accessed from the new Analytic module. In the module, users can view a listing of KPIs with the status of the metric and historical trending. Communication logs can also be accessed in case users wish to collaborate in tracking and logging actions for improving the KPI status.

Other preferred ways to share Maximo data outside the Start Center are through Maximo Integration Framework, web services for accessing KPI data programmatically, reporting capabilities of Maximo reports, and data visualization tools such as Power BI, Tableau, or other dashboarding solutions.
When sharing KPI data outside the Maximo Start Center, it’s essential to consider data security and access controls. Ensure that sensitive information is appropriately protected and access privileges are defined based on the intended recipients’ roles and responsibilities.
Conclusion
Understanding and implementing Key Performance Indicators (KPIs) in asset management using Maximo can significantly enhance an organization’s ability to monitor, analyze, and improve its operational performance.
KPIs provide critical insights into key metrics and enable data-driven decision-making, helping organizations optimize asset utilization, reduce downtime, and enhance overall efficiency. By leveraging Maximo’s capabilities, organizations can establish a robust KPI framework that aligns with their asset management goals and facilitates continuous improvement.
Banetti is an Enterprise Asset Management consulting company that helps companies seamlessly implement IBM Maximo’s Enterprise CMMS platform. So if you are planning to invest in IBM’s Maximo KPI, get in touch with Banetti for a seamless onboarding experience.